Grade 5 Media Survey
- Mar 17, 2022
- 1 min read
Updated: Apr 7, 2022
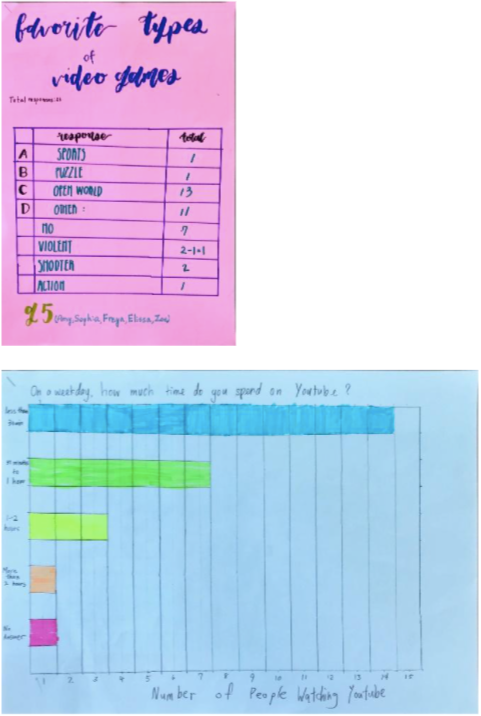
We have been learning about different forms of media in grade 5. To better understand what types of media are popular amongst students, and how much time students spend on specific types of media, we conducted a media survey.
After collecting the results of the survey, each group of students had to choose the graph they wanted to use to display the information: pie graph, vertical bar graph, horizontal bar graph, or data table. Finally, students were asked to write a brief reflection to answer the question, “What did you learn about making graphs?”
Besides connecting to our media unit, we’re hopeful that the grade 5 students will be able to call upon their data collection and display skills for the exhibition!


Comments